 Operatività derivati 20 novembre 2006
 |
| Autore |
Discussione |
|
Zigarum
Membro
Registrato dal:
05/04/2006
Messaggi:
1996
 Offline Offline |
| Inviato il: 19/11/2006 - 13:55:11 |


|
|
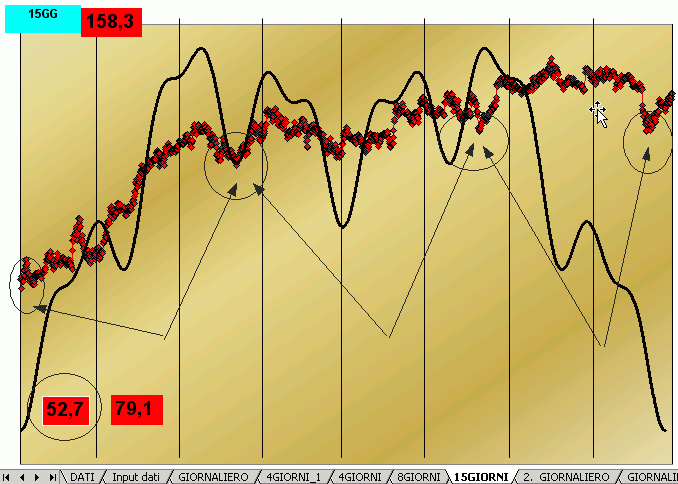
Intanto che aspetto il pranzo 
15GG
Da un po di tempo non riuscivo piu a trovare la fine di un SETTIMANALE.Penso di averne capito il motivo.
In pratica spicciola su un cilco a 15GG non fa piu 2 settimanali, ma bensi 3 cicli a 4gg leggermente piu lunghi ,da 50 ore all incirca come si vede dall ellissi
dal grafico si vede meglio.
Se è giusto il modo operandi credo che lunedi si salga e ben bene.
|
|
|
Zigarum
Membro
Registrato dal:
05/04/2006
Messaggi:
1996
 Offline Offline
|
| Inviato il : 19/11/2006 - 13:57:28 |


|
|
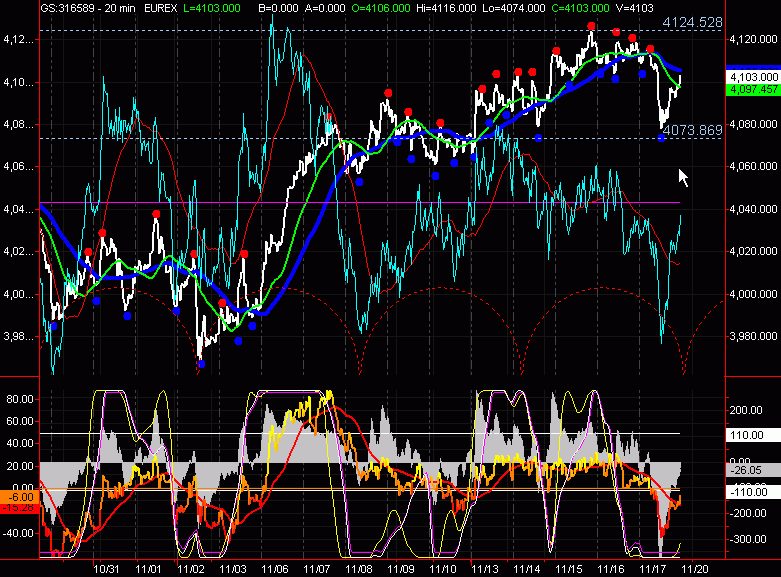
questo è il 4GG
dove si vede che al 90% il ciclo dovrebbe esser finito
|
|
|
Zigarum
Membro
Registrato dal:
05/04/2006
Messaggi:
1996
 Offline Offline
|
| Inviato il : 19/11/2006 - 13:59:51 |


|
|
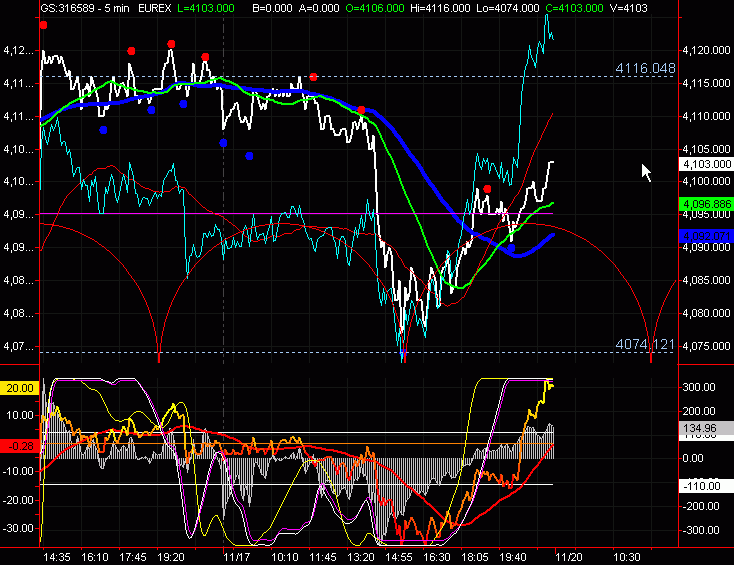
Giornaliero
in questo momento è ancora negativo x tornar positivo deve rompere perlomeno 4116. o al limite quando chiudera questo giornaliero non scendere sotto 4074.
e quando ripartira salire sopra il max fatto da questo GG
|
|
|
Zigarum
Membro
Registrato dal:
05/04/2006
Messaggi:
1996
 Offline Offline
|
| Inviato il : 19/11/2006 - 14:03:02 |


|
|
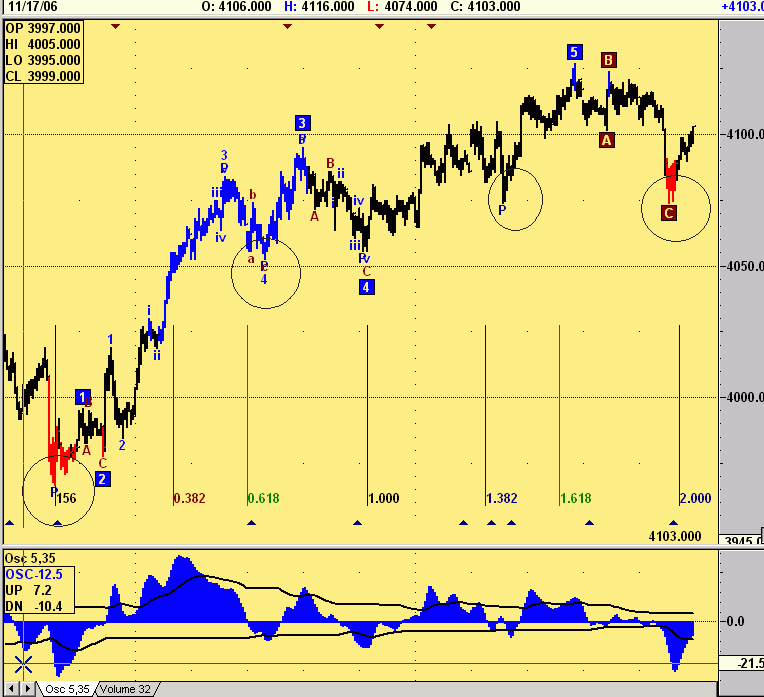
x riprendere il 1 grafico a 15 GG questo è il corrispettivo a 30m fatto partire dalla partenza del 15GG
|
|
|
Zigarum
Membro
Registrato dal:
05/04/2006
Messaggi:
1996
 Offline Offline
|
| Inviato il : 19/11/2006 - 14:10:43 |


|
|
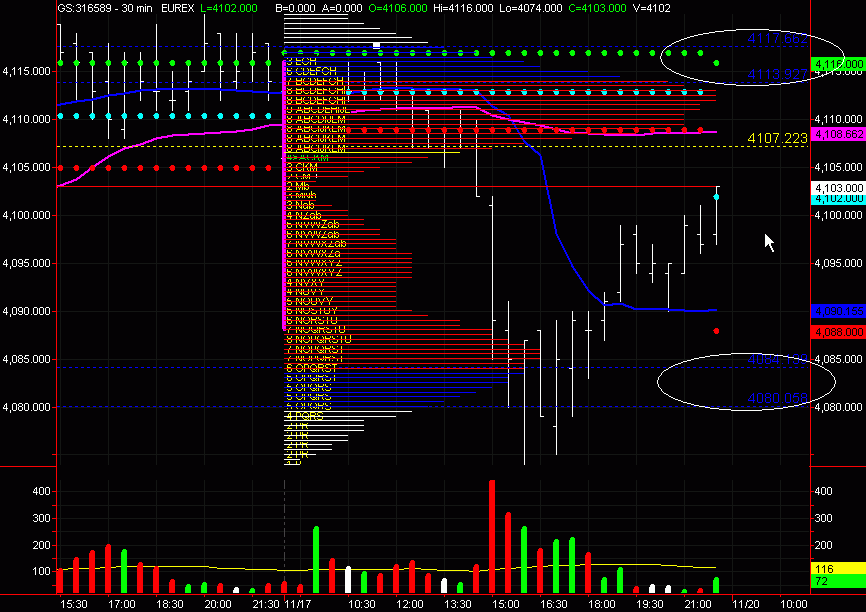
questo è un po complicato ma di semplice deduzione ,lavora sui volumi.
x cui a guardarlo cosi ci dice che sopra l'ellisse da4113/4117, il mercato passa in mano ai compratori
4080/4084 l'inverso mercato in mano ai venditori.
tra 4106/4111 e il punto di controllo. del mercato.
vado a pranzo a domani o piu tardi, x il momento ...
Forza ROMA   
|
|
|
SOLOMARE
Moderatore
Registrato dal:
05/04/2006
Messaggi:
2305
 Offline Offline
|
|
|
SOLOMARE
Moderatore
Registrato dal:
05/04/2006
Messaggi:
2305
 Offline Offline
|
| Inviato il : 19/11/2006 - 14:25:09 |


|
|
SONO stato da venerdì sera a oggi a studiarmi una serie di cose importantissime..si forse si salirà ancora ma abbiamo pochissimo spazio...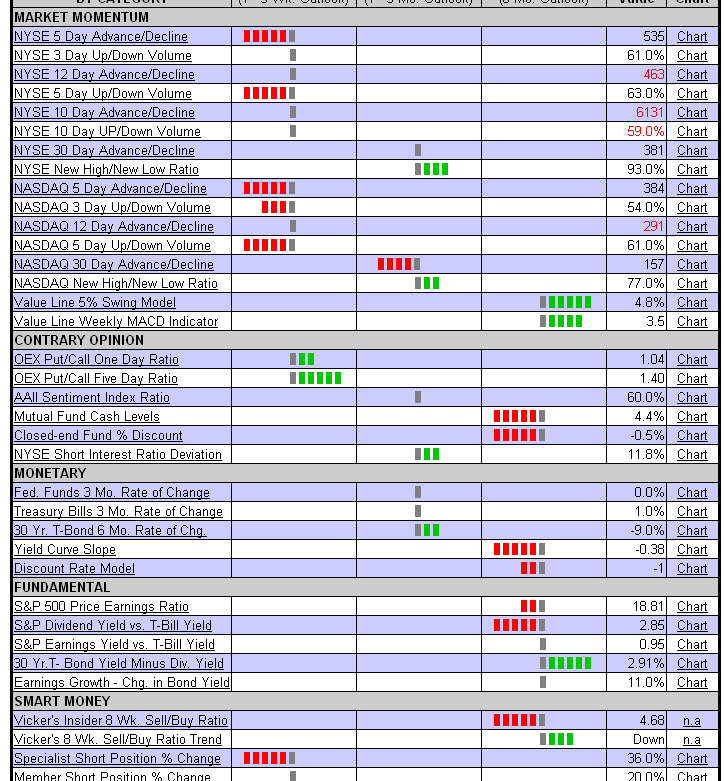
|
|
|
SOLOMARE
Moderatore
Registrato dal:
05/04/2006
Messaggi:
2305
 Offline Offline
|
| Inviato il : 19/11/2006 - 14:32:05 |


|
|
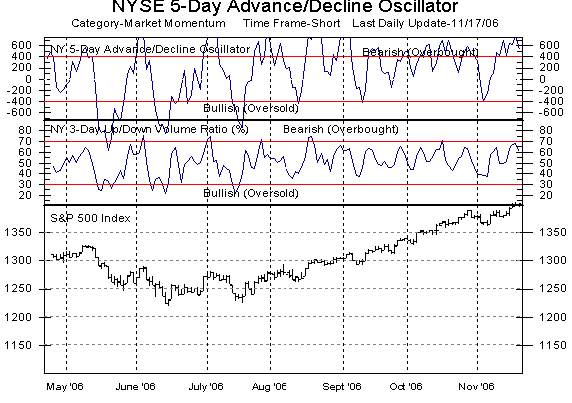
per farti SOLO un esempio questo indicatore non fallisce mai,ma non è ancora girato del tutto studiandolo bene e guardando 200 grafici vari ..per farmi capire ti metto SOLO alcune cose ma è difficile da spiegare sul fol...se guardi nyse e nax vedi che il 5 giorni è il 3 giorni di advance decline è bearish..il 12 giorni no è ancora neutrale,quindi potrebbero pure salire ancora ..ma...il giorno che gira il 12 giorni e tutte 3 gli indicatori sono shhort sia su nax e che su nuse c sarà una forte discesa..è non siamo così lontani...
|
|
|
SOLOMARE
Moderatore
Registrato dal:
05/04/2006
Messaggi:
2305
 Offline Offline
|
| Inviato il : 19/11/2006 - 14:33:17 |


|
|
strategia di questo indicatore 
Time Frame: Short
Category: Momentum
Description
Each day the breadth of the market can be measured by subtracting the number of declining stocks from the number of advancing stocks. A large positive number indicates a strong day, while a negative result represents a weak day. This daily breadth number is the foundation for the calculation of numerous market momentum indicators. The internal strength of the market can also be monitored by tracking the volume in rising stocks relative to the volume in those falling. Understanding the dynamics of the internal market can help identify when the market trend is likely to change its course.
Calculation & Significant Levels
NY 5-Day Advance/Decline Oscillator: A five-day moving average of the daily difference between the advancing and declining issues.
Overbought is >+400 and oversold is <-400.
Formula: Five-day average of (advancing issues - declining issues)
Gauge Elements: Magnitude, Time, Slope
Updated: Daily
Strategy
The short-term internal momentum of the market often turns prior to the price changing trend. This momentum indicator should be used with the strength of the longer term trend in mind. Each of these oscillators should be viewed as a part of one whole indicator. The 5-day advance/decline value should be confirmed by the 3-day up/down volume value. The 12-day advance/decline value should be read in conjunction with the 5-day up/down volume value. The market may be over-extended when any one of these oscillators are overbought or oversold, but it is most significant when the oscillators confirm one another and change their trend in an over-extended area. Historically, when three or four of the oscillators reached an extreme and all turned within a two week time span, the market's trend changed. In a strong trending market it is common to see the 3-day advance/decline value become overbought and reverse while the price continues its trend. This pattern is more significant when the 12-day advance/decline value and the volume oscillators subsequently become extended and reverse in warning levels. The indication is even stronger if both the NYSE and NASDAQ have the same internal momentum patterns developing.
|
|
|
SOLOMARE
Moderatore
Registrato dal:
05/04/2006
Messaggi:
2305
 Offline Offline
|
| Inviato il : 19/11/2006 - 14:36:27 |


|
|
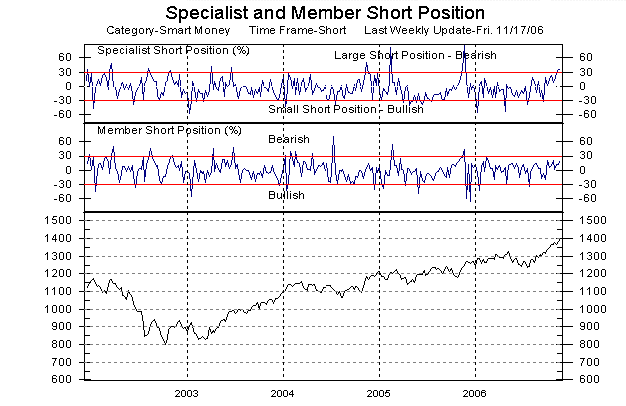
poi abbiamo anche questo indicatore moplto importante
ti allego la strategia per capirlo 
Description
The specialists are responsible for maintaining orderly markets in the NYSE-listed stocks. They are in the best position to "feel" the supply and demand for the stocks in which they make markets. When the specialists, on balance, show extremely bullish or bearish positions they are generally correct. The members of the NYSE are also privy to good information. This may explain why this group tends to be correct when it is unusually bullish or bearish.
Calculation & Significant Levels
Specialist and Member Short Position: The calculation is the same for both the specialists and the members' short position. The size of the current short position is compared to the average size short position over the last six months. An increase of over 30% is bearish, and a decrease by more than 30% is bullish. The NYSE reports the data weekly with a two week delay, but the indicator is still quite effective.
Formula:
(Current short position) - (average short position of last 6 months)
-------------------------------------------------------------------
(average short position over last 6 months)
Gauge Elements: Magnitude, Time
Updated: Weekly (as of Friday close)
Strategy
Two important factors of this indicator should be evaluated. First, specialists are short-term traders. Second, only fluctuations to an extreme are considered significant. When both components (specialist and members) of this indicator have exceeded +30% over their average there has been a tendency for the market to go sideways or down over the following two weeks. On the other hand, when both components indicate short positions are 30% smaller than normal it is a bullish opinion worth respecting for the following two weeks.
|
|
|
SOLOMARE
Moderatore
Registrato dal:
05/04/2006
Messaggi:
2305
 Offline Offline
|
| Inviato il : 19/11/2006 - 14:44:17 |


|
|
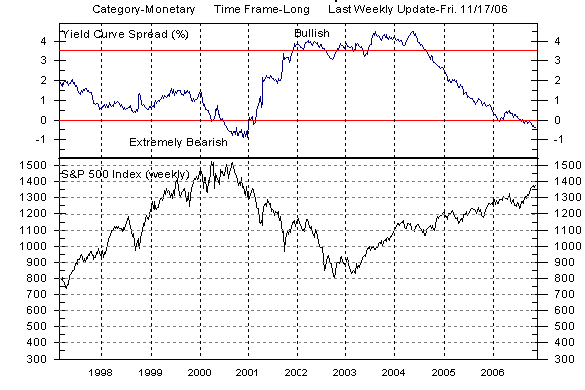
poi abbiamo la curva di slope
ti metto anche la strategia e se guardi il grafico anche senza leggere ti rendi conto che SOLO nel 2001 e scesa sotto lo zero...oem dico sempre saliranno forse ancora ma occhi aperti al momento si rischia molto meno su uno short che su un long...se la curva di slope gira come ha fatto sempre e ben dopo 3 anni ..il merkato non scende ma krakka e va in recessione specie se si torna sopra 1
ma al momento siamo sotto lo zero..ma ocio
The yield curve is the relationship between short-term interest rates and long-term interest rates. Normally, the yield curve is upwardly sloping reflecting higher yields on longer maturity bonds. Since the issuer of a bond is not obligated to pay the par value of the bond until maturity, the holder of the bond assumes the possibility of incurring a loss in nominal and/or "real" dollars. A nominal loss is incurred when the bond is sold at a capital loss. A "real" dollar loss occurs when the fixed income return is less than inflation. Longer maturities increase the possibility of incurring a capital loss and/or inflation diverging from its expected rate causing a "real" loss. Therefore, longer maturity bonds carry more risk which is normally compensated for with a higher nominal rate of return.
When the yield curve becomes inverted (short-term yields are higher than long-term yields) it is invariably bearish for stocks. An inverted yield curve may be caused by an unusually high demand for short-term funds (a near-term liquidity problem in government or business), a surge in short-term inflationary pressures, or a very restrictive monetary policy by the Federal Reserve. All three instances - liquidity problems, inflation and tight monetary policy, have negative implications for the economy and the stock market.
Calculation & Significant Levels
Yield Curve: The yield on the 30-year treasury bond minus the yield on the three-month T-Bills. When the yield curve spread is greater than 3.5% (very steeply upward sloping) it is bullish for stocks, and when the yield curve is negative (inverted) it is a bearish indication for stocks.
Formula: (Long Bond yield) - (T-Bill yield)
Gauge Elements: Magnitude
Updated: Weekly (as of Friday close)
Strategy
The yield curve will always be a factor in the future direction of the stock market, but it is most useful as an indicator when it becomes either very positive or inverted. Historically, an inverted yield curve has been followed by a recession and falling stock prices. A steep upwardly sloping yield curve with a spread of greater than 3.5% usually supports higher stock prices.
|
|
|
SOLOMARE
Moderatore
Registrato dal:
05/04/2006
Messaggi:
2305
 Offline Offline
|
| Inviato il : 19/11/2006 - 14:50:32 |


|
|
poi abbiamo questo
sono SOLI alcuni degli indicatori che vedi sul primo post...questo si chiama
Vicker's inside 8 week..sell/buy ratio..non ho il grafico ma al momento si trova a 4.68..qui sotto ti metto o vi metto le spiegazioni
cmq in parole povere sotto 2 siamo long sopra 2.5 siamo short..questo indicatore prelude ad un imminente picco delle azioni nei prossimi 3/6 mesi...
A corporation's officers and directors are required to notify the SEC whenever they buy or sell shares of their company's stock. These insiders usually know more about the prospects of their company than most investors. When insiders buy or sell their company's stock it is conjectured that they state their opinion of the company's future. When there is an unusually large amount selling by insiders market wide it is an indication that the stock market may be overvalued. If insiders are buying aggressively it is signal that the "smart money" believes the market will rise. This was the case in January of 1995 when, according to the Vickers Insider Sell/Buy ratio, insiders were more bullish than they had been, on average, in all of 1994.
Calculation & Significant Levels
Vickers Insider Sell/Buy Ratio: Calculated by dividing the total number of insider sales transactions into the total number of buys filed with the SEC each week. The indicator is an eight-week moving average of the weekly ratio. A reading of less than 2.0 is bullish and over 2.5 is bearish.
Formula:
Eight-week average of (weekly insider sales/weekly insider buys)
Gauge Elements: Magnitude, Slope
Updated: Weekly (as of Friday close)
Strategy
The trend of the buy/sell ratio is as important as the absolute value. A value below 2.0 suggests a rising market, but it is a stronger indication if the ratio has also been declining over the previous eight weeks. If the ratio is over 2.5 and climbing is a warning that insiders are anticipating a market peak. Historically, insiders' actions are an early but worthy indication of what might develop in the upcoming three to six months.
|
|
|
SOLOMARE
Moderatore
Registrato dal:
05/04/2006
Messaggi:
2305
 Offline Offline
|
| Inviato il : 19/11/2006 - 14:57:26 |


|
|
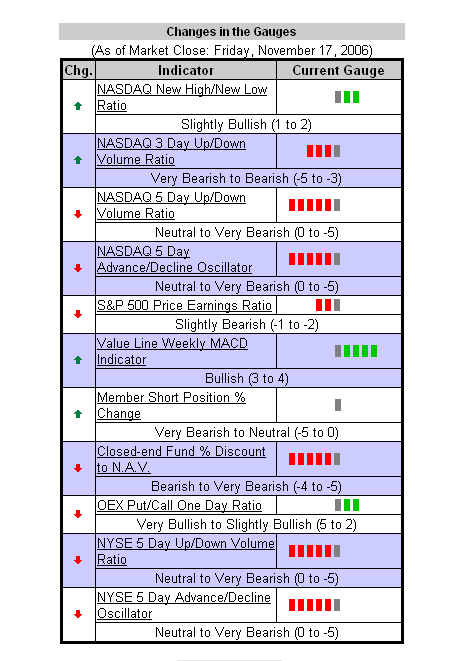
questo è un piccolo riassunto di valutazione generale
e sono quasi tutti in rosso ma non ancora tutti peccato
|
|
|
SOLOMARE
Moderatore
Registrato dal:
05/04/2006
Messaggi:
2305
 Offline Offline
|
|
|
aiooo
Membro
Registrato dal:
28/09/2006
Messaggi:
175
 Offline Offline
|
|
|
SOLOMARE
Moderatore
Registrato dal:
05/04/2006
Messaggi:
2305
 Offline Offline
|
| Inviato il : 19/11/2006 - 15:18:28 |


|
|
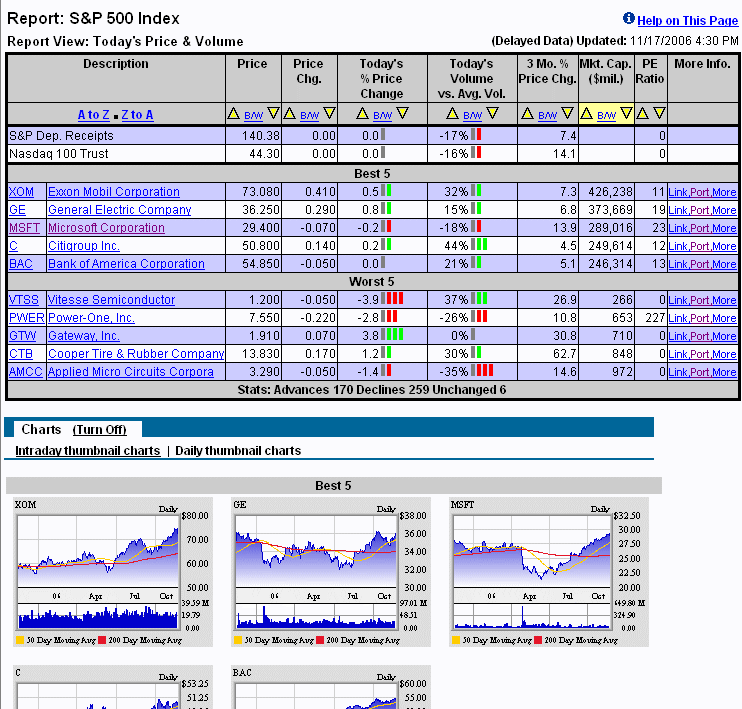
e per tornare q l'indicatore sopra guardando lo sp vediamo che nonostante il saldo positivo di venrdì abbiao avuto 170 titoli in adavances 257 in declines
|
|
|

